Descriptive statistics
About descriptive statistics
Descriptive statistics (in the count noun sense) - is a summary statistic that quantitatively describes and summarizes features of a collection of information, while descriptive statistics are in the mass noun sense - is the process of using and analyzing those statistics. Descriptive statistics are distinguished from inferential statistics (or inductive statistics), in that descriptive statistics to summarize a sample, rather than use the data to learn about the population.
Descriptive statistics provide simple summaries about the sample and about the observations that have been made.
Descriptive analysis limits generalization to a particular group of individuals observed. No conclusions extend beyond this group and any similarity to those outside the group cannot be assumed. The data describe one group and that group only. Much simple action research involves descriptive analysis and provides valuable information about the nature of the particular group of individuals.
The descriptive analysis of data provides the following:
- The first estimates and summaries, arranged in tables and graphs, to meet the objectives.
- Information about the variability or uncertainty in the data.
- Indications of unexpected patterns and observations that need to be considered when doing formal analysis.
Descriptive analysis is used to describe the basic features of the data in the study. They provide simple summaries about the sample and the measures. Together with simple graphical analysis, they form the basic virtual of any quantitative analysis of data.
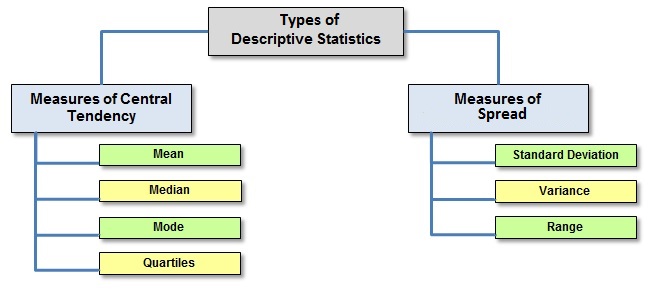
Typically, there are two general types of statistic that are used to describe data:
- Measures of central tendency: these are ways of describing the central position of a frequency distribution for a group of data. In this case, the frequency distribution is simply the distribution and pattern of marks scored by the 100 students from the lowest to the highest. We can describe this central position using a number of statistics, including the mode, median, and mean.
- Measures of spread: these are ways of summarizing a group of data by describing how spread out the scores are. For example, the mean score of our 100 students may be 65 out of 100. However, not all students will have scored 65 marks. Rather, their scores will be spread out. Some will be lower and others higher. Measures of spread help us to summarize how spread out these scores are. To describe this spread, a number of statistics are available to us, including the range, quartiles, absolute deviation, variance and standard deviation.
When we use descriptive statistics it is useful to summarize our group of data using a combination of tabulated description (i.e., tables), graphical description (i.e., graphs and charts) and statistical commentary (i.e., a discussion of the results).